Topic and Trend Analysis Solution
Overview
Topic Analysis is a Natural Language Processing (NLP) task of extracting salient terms (or topics) from a textual corpus. Trend Analysis task measures the change of the most prominent topics between two time points.
The solution is based on Noun Phrase (NP) Extraction from the given corpora. Each NP (topic) is assigned a proprietary importance score that represents the significance of the noun phrase in the corpora (document appearances, phrase-ness and completeness).
Flow
The first stage is to extract the topics from the two textual corpora:
- A target corpus (e.g., current month’s financial reports)
- A reference corpus (e.g., last month’s financial reports).
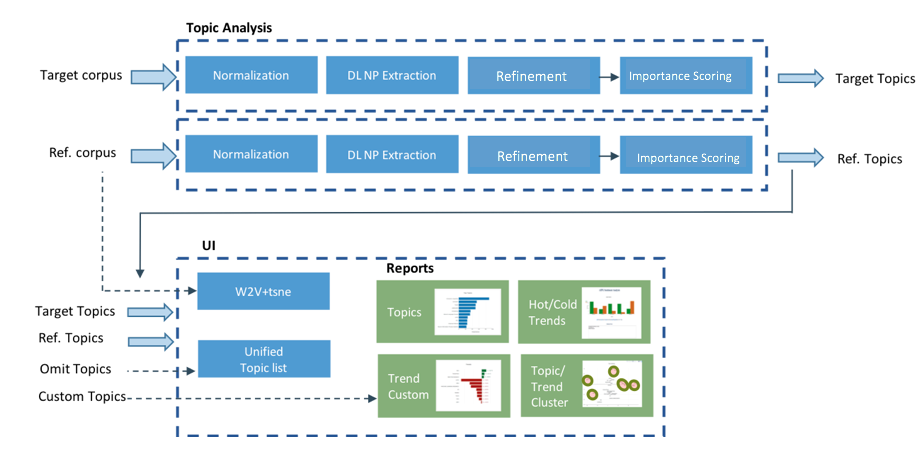
The analysis is done by running the two corpora through the Topic Extraction pipeline: Normalization -> Noun Phrase extraction -> Refinement -> Scoring. In this stage, the algorithm will also train a W2V model on the joint corpora to be used for the clustering report (this step can be skipped). In the second stage the topic lists are being compared and analyzed. Finally the UI reads the analysis data and generates automatic reports for extracted topics, “Hot” and “Cold” trends, and topic clustering in 2D space.
The noun phrase extraction module is using a pre-trained model which is available under the Apache 2.0 license.
Flow diagram

Reports
- Top Topics: highest scored topics from each corpora
- Hot Trends: topics with highest positive change in scores
- Cold Trends: topics with highest negative change in scores
- Trend Clustering: scatter graph showing trends clusters
- Topic Clustering: scatter graph showing topic clusters for each corpus
- Custom Trends: topics selected by the user to monitor (see section: Filter Phrases and Custom Trends)
Usage
Requirements
Install solution extra packages:
pip install -r solutions/trend_analysis/requirements.txt
First stage
usage: python solutions/trend_analysis/topic_extraction.py [-h] [--notrain] [--url] [--single_thread]
                           target_corpus ref_corpus

positional arguments:
  target_corpus    a path to a folder containing text files
  ref_corpus       a path to a folder containing text files

optional arguments:
  -h, --help       show this help message and exit
  --no_train        skip the creation of w2v model
  --url            corpus is provided as csv file with urls
  --single_thread  analyze corpora sequentially
The topic lists will be saved to csv files, which are the input of the second stage.
When using the –url flag, both target_corpus and ref_corpus should be a csv file containing url links to analyze (a single url per row).
To use the trend analysis step (step below) it is required to run the topic extraction above without --no_train option.
Second stage
usage: python solutions/trend_analysis/trend_analysis.py [-h] [--top_n TOP_N] [--top_vectors TOP_VECTORS]
                     target_topics ref_topics

positional arguments:
  target_topics         a path to a csv topic-list extracted from the target
                        corpus
  ref_topics            a path to a csv topic-list extracted from the
                        reference corpus

optional arguments:
  -h, --help            show this help message and exit
  --top_n TOP_N         compare only top N topics (default: 10000)
  --top_vectors TOP_VECTORS
                        include only top N vectors in the scatter graph
                        (default: 500)
The input to the second stage is the output lists from the first stage (topic extraction). The analysis results will be saved into the data folder and will be used by the UI at the last stage.
UI stage
In order to visualize the analysis results run:
python solutions/start_ui.py --solution trend_analysis
You can also load the UI as a server using –address and –port, for example:
python solutions/start_ui.py --solution trend_analysis --address=12.13.14.15 --port=1010
and then access it through a browser: http://12.13.14.15:1010/ui
Filter Phrases and Custom Trends
By default, all topics will be analyzed (according to the top N threshold, if provided), and the Custom Trends graph will be empty. The user can filter phrases he wants to omit from the results (post analysis) by selecting the “Filter” radio button, click on the “Filter Topics” tab, and de-select the unwanted topics (currently de-selection is done by holding the Ctrl button and click on a cell). Similarly, in order to select custom trends to be presented in the Custom Trends graph, click on the “Custom Trends” tab and select the phrases to show.
For a permanent custom/filtering, edit the ‘valid’/’custom’ column in the file: data/filter_phrases.csv (assign 1 to show a phrase and 0 otherwise), save the file and refresh the reports web page.